AI and Events: Mastercard Spending Pulse
TLDR:
Spending Pulse is an application that helps client companies see their spending trends. Although a lot of my work at Mastercard Labs was in quick bursts and often experimental, this project stands out because it was one of those initiatives to lead ideation along with a Product Manager lead and bring an existing successful Mastercard enterprise application into its 2.0 phase. This project involved AI/ML but was also very ambiguous in terms of final deliverables, and apart from my facilitation and ideation work with the Mastercard team who owned the product, my main contribution was to kickstart their design and provide them with a vision to begin with.
The End Product
The design of a high-priority feature of Spending Pulse 2.0—Events—along with a client demo prototype. This feature entails adding AI (Machine Learning) to provide a real-time assessment of the effect of events or incidents that affect project and marketing spending to better mitigate accompanying business risks.
My Role
Product Designer
The Problem
For any company, unforeseen events may affect budgeting and spending. Examples of these events are natural (ex. calamities), political, financial, and legal (ex. passing of certain laws in a relevant state).
Team
Product Management, Design, Development Team
Keywords
Mobile, User Experience, Design Thinking, Ideation, Data Visualization, Artificial Intelligence, Machine Learning, Risk Management, Financial Management
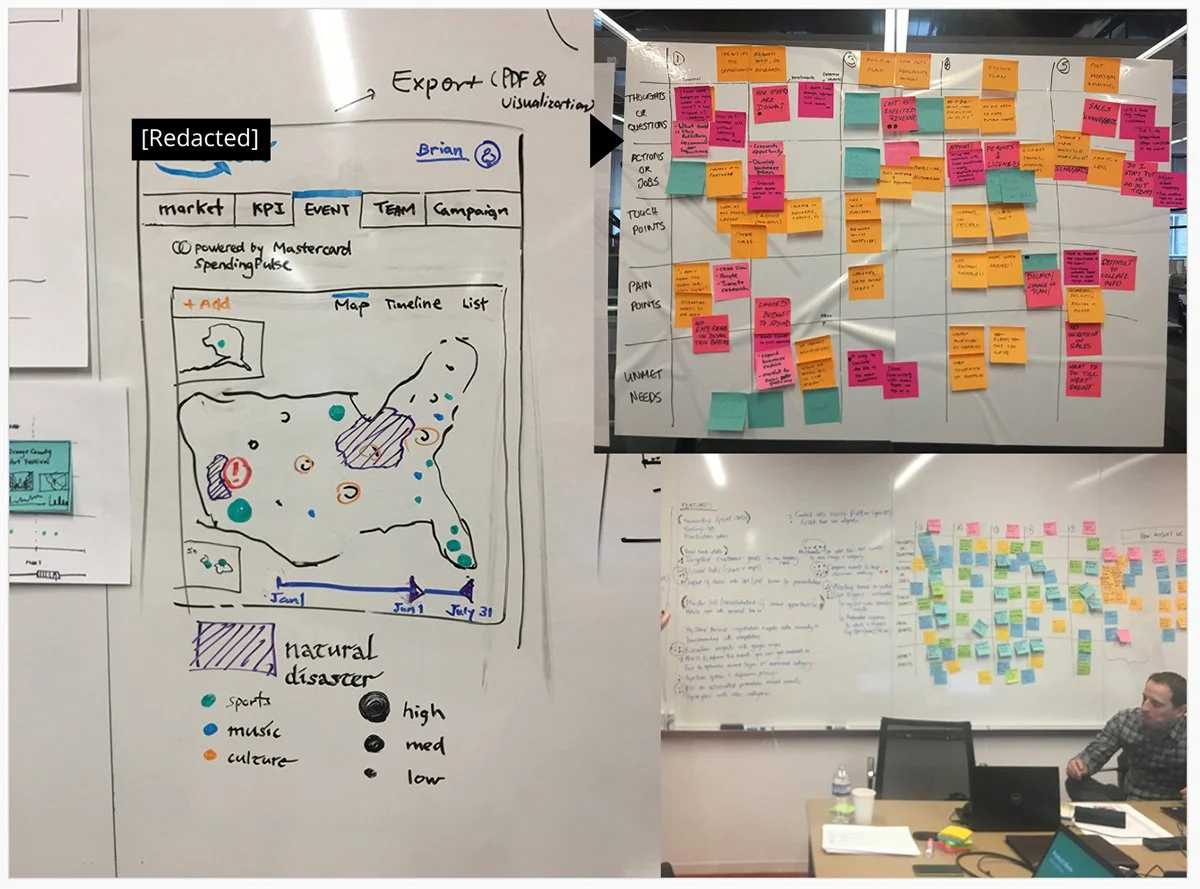
1. Ideation
We explored small, medium, and large business scenarios and split into sub-teams as such. The tasks included persona creation, “How might we” sessions, user journey mapping, sketching, and other design thinking exercises.
As mentioned above, my role included guiding the small business sub-team, while also being the general voice of the user for the larger team, and then arriving at a mobile prototype and a script for the executive demo video..
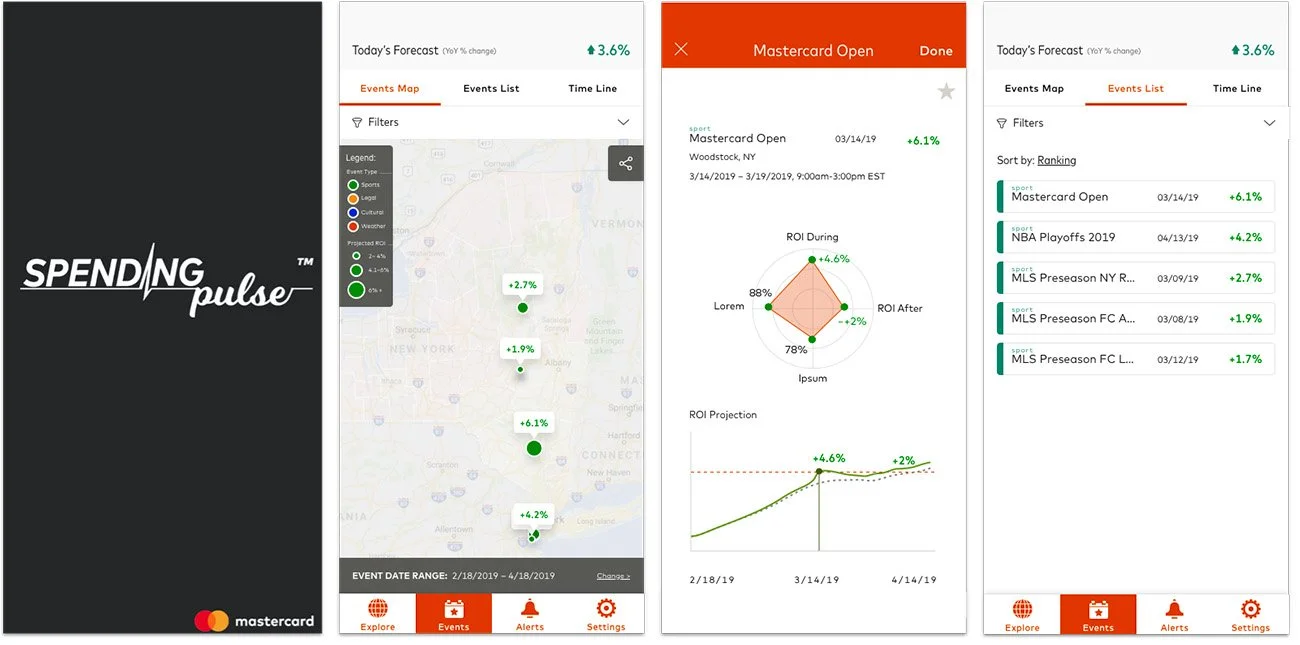
2. Map Screens
The resulting UI for the Events AI feature was to add a new main section of the mobile app called “Events”.
Also, in place of the current spending heatmap (left of image), I introduced a bubble map. The size of the bubble would be proportionate to the potential cost impact or savings that our high-level Director-level Persona can take a glance at and perhaps bookmark for further investigation.
3. Bookmarking, Event Details
Conceptually, I also introduced a spider area chart that would give takeaways on a specific prediction. Apart from ROI (during and after an event), I proposed a certain measure of certainty for the prediction (AI and data reliability)—to put that “grain of salt” in the prediction.
Also shown here are methods for filtering evens as well as the bookmarking feature.